Đang tải nội dung…
All articles
There is an index. Why is PostgreSQL still scanning the table?
The same index leads to different plans for 600 matching rows and 59,400 matching rows.
Index, Query Optimizer & SQL Performance · Part 1
Fictional setting, real lab evidence. Fortex in this series is a fictional setting; Tom and Ben are characters. Their conversations illustrate the reasoning. Measurements and assertions come from the linked Docker lab, not Fortex production incidents.
The Fortex journey · Chapter 2/8
Ben added an index. Seq Scan stayed
After the MySQL cleanup, Ben moved to the event search screen in a PostgreSQL service at Fortex. He remembered their discussion of pages and wanted the database to read less. Indexing the status column used in WHERE seemed like an obvious next step.
“It's still scanning the table. Should we force the index?”
Tom looked at the query. “How common is that status?”
“It's in the filter. I thought an index would help.”
“I see what you're aiming for: go straight to the matching rows. Let's try two values of the same filter. Would both queries need the same amount of data?”
Ben stopped to think. Yesterday he had confused row count with file size. Perhaps has an index was hiding another quantity today.
What an index lookup leaves to do
Ben reopened his notes about pages from the MySQL cleanup. Tom reminded him to carry the question across engines, not assume identical internals.
“The index gives us the row location,” Ben said. “Then we just fetch the data.” Tom circled payload. “That just is worth measuring. Where is this column stored?”
If pages and storage allocation are unfamiliar, start with the MySQL file-size experiment. This article uses PostgreSQL 17.6, where table data resides in a heap.
SELECT sum(length(payload))
FROM events
WHERE status = 'rare';
A B-tree on status finds matching entries, but payload is not in that index. The executor still needs heap tuples, visibility checks, payload values, and the aggregate.
A Seq Scan walks table pages and tests rows. An Index Scan follows the index to heap tuples. A Bitmap Index Scan and Bitmap Heap Scan gather tuple locations before visiting heap pages. These are alternative cost structures, not a universal worst-to-best ranking. See PostgreSQL's EXPLAIN guide.
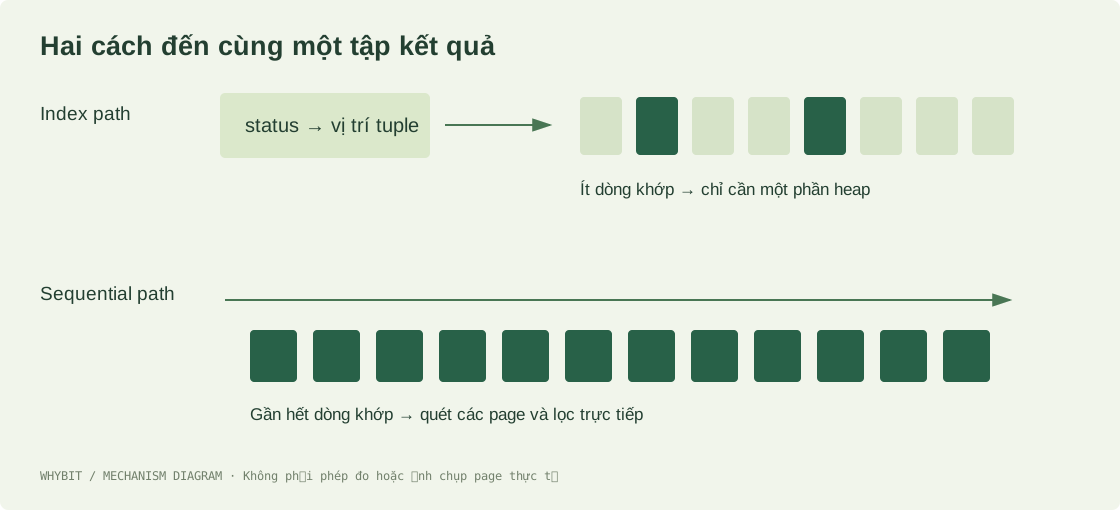
This is a conceptual access-path diagram, not a measured page layout. When almost every row matches, traversing an index and then most of the heap can add work. There is no universal selectivity percentage where indexes stop being useful: physical correlation, requested columns, cache, table size, LIMIT, ordering, and planner costs all matter.
Deliberately skewed data
Ben suggested grabbing an arbitrary sample. Tom proposed a distribution they could predict instead. Ben prepared the rare and common groups and kept the payload identical across branches.
The lab generates 60,000 rows. IDs divisible by 100 have status rare; all others are common. That gives exactly 600 rare rows and 59,400 common rows, with deterministic 256-character payloads.
CREATE TABLE events (
  id INT PRIMARY KEY,
  status TEXT NOT NULL,
  payload TEXT NOT NULL
);
INSERT INTO events
SELECT n,
       CASE WHEN n % 100 = 0 THEN 'rare' ELSE 'common' END,
       repeat(md5(n::text), 8)
FROM generate_series(1, 60000) n;
ANALYZE events;
Summing payload lengths keeps a nonindexed column necessary. A COUNT-only comparison could introduce an index-only case and answer a different question.
The digest-pinned PostgreSQL container has one CPU, a 512 MB limit, 64 MB shared buffers, disabled parallel query for this comparison, and disposable tmpfs data. These timings are not NVMe, throughput, or production p99 measurements. Run the downloadable source with python3 labs/engine.py postgres-index-selectivity.
Compare plans, then force an alternative diagnostically
“If common doesn't use the index, I'd still like to force it once.”
“Good comparison,” Tom said. “Keep it as an experiment, and verify the aggregate stays the same. It isn't a reason to change the server-wide setting.”
Before adding a status index, both conditions scan the table. The primary key on id does not directly answer a status condition.
CREATE INDEX events_status_idx ON events(status);
ANALYZE events;
EXPLAIN (ANALYZE, BUFFERS, FORMAT JSON, TIMING OFF)
SELECT sum(length(payload)) FROM events WHERE status = 'rare';
| Condition | Status index | Matches | Observed plan | Shared hit / read |
|---|---|---|---|---|
| rare (1%) | Absent | 600 | Seq Scan | 2223 / 0 |
| common (99%) | Absent | 59400 | Seq Scan | 2223 / 0 |
| rare (1%) | Present | 600 | Index Scan | 600 / 2 |
| common (99%) | Present | 59400 | Seq Scan | 2223 / 0 |
| common (99%) | Present, forced path | 59400 | Bitmap Heap Scan + Bitmap Index Scan | 2224 / 50 |
For rare, the planner uses an index path; for common, it still chooses Seq Scan after ANALYZE. The driver also disables sequential scans in one diagnostic session and repeats the common query. In the published run, this produces a Bitmap Heap Scan plus Bitmap Index Scan. It still processes 59,400 matching rows and touches nearly the entire heap.
SET enable_seqscan = off; -- diagnostic lab session only
Do not treat that setting as a production fix. It provides an alternative path for a controlled comparison.
What the timings can support
Ben looked up from the samples. “The forced path has the lower median. We can't write that Seq Scan was faster here.”
“Correct,” Tom said. “A cost explanation doesn't overrule a measurement. These samples help us inspect the plans, but they don't settle a small performance difference.”
Ben had caught a conclusion in the draft before Tom needed to ask.
| Indexed condition | Five warm samples (ms) | Median (ms) |
|---|---|---|
| rare, planner choice | 0.828 / 0.834 / 0.864 / 0.862 / 0.905 | 0.862 |
| common, planner choice | 15.183 / 12.848 / 15.073 / 14.923 / 14.86 | 14.923 |
| common, forced index | 14.999 / 13.256 / 13.173 / 13.578 / 15.012 | 13.578 |
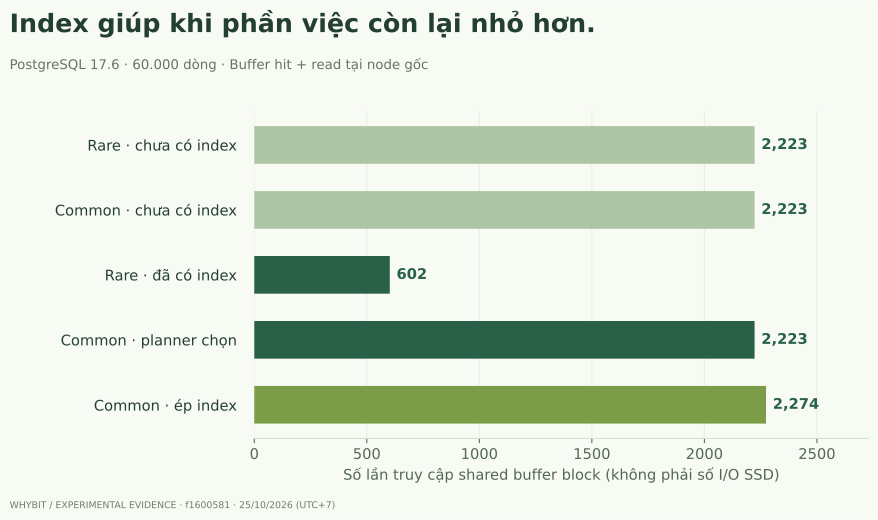
There are five sequential warm samples per indexed condition. The common branches have similar medians here; the forced-index median is actually lower. A small difference from these few samples cannot establish which path is reliably faster. Execution order was not randomized, noisy neighbors were not controlled, and no confidence interval supports a small performance claim.
The strong result is that selectivity changed the chosen plan while calculation results stayed identical. It does not establish a universal threshold or prove that Seq Scan always wins for broad filters.
The report, raw logs, and EXPLAIN JSON artifacts retain estimates, actual rows, child nodes, buffer counters, and checksums. Those details are more useful diagnostically than one elapsed time.
Choose a remedy for the actual problem
“I won't file a ticket saying ‘remove Seq Scan’,” Ben said. “I'll name the slow query, its columns, and the data distribution.”
“Then we have something we can choose a fix for,” Tom replied.
| Option | Useful when | Cost |
|---|---|---|
| Keep Seq Scan | Much of the table is needed and the plan meets the target | Scanning still consumes resources under concurrency |
| Add a suitable index | Filtering, joining, ordering or limiting benefits | Storage and maintenance on writes |
| INCLUDE columns | A query can benefit from index-only access | Larger index; visibility map and update workload still matter |
| Partial index | A small, frequently queried subset has a suitable predicate | Predicate compatibility and changing distributions |
| Improve statistics | Estimated and actual rows differ materially | ANALYZE cost; statistics cannot repair every query structure |
| Force an alternative for diagnosis | Testing a specific planner hypothesis | Dataset-dependent results and risk of hiding estimation problems |
Only index creation and the forced alternative were tested. Review index-only scans, partial indexes, and planner statistics before treating those options as solutions.
The index occupies 434,176 bytes, about 0.41 MiB. This experiment does not benchmark write overhead, so it provides no invented percentage for slower INSERT, UPDATE, or DELETE.
Distributions change
Ben saved the plan as a baseline. “Would your conclusion survive if the rare status became common after an import?” Tom asked. Ben added the distribution to the measurement notes.
An index useful when pending rows represent one percent can tell a different story when a downstream outage pushes that share to seventy percent. Conversely, a sequential scan on a small cached table can be cheap enough that additional indexes only add maintenance.
Heap growth also affects the work involved. The snapshot and VACUUM lab shows how row count can remain fixed while the heap grows.
When investigating a scan, check index-compatible expressions and types, estimated versus actual rows, required columns, heap access, buffers, expensive sorts or loops, and whether statistics reflect current data. If trying another plan, compare results as well as work and use representative measurements.
Creating an index gives the optimizer another option. It does not make that option the best answer to every query.
The page Ben takes into tomorrow
Ben left the Fortex service's planner settings alone. He kept the experiment as evidence for choosing improvements against the real query and workload. He underlined a sentence on page two: “A new access path is an option. Count the remaining work before choosing.”
As he closed his laptop, he noticed a reporting transaction still open. It only reads, he thought. Then he remembered the sentence he'd just written and called Tom back.
Previous chapter: Deleted 90% of the rows. Why is the MySQL file still the same size? · Next chapter: How a read-only transaction can keep a PostgreSQL table bloated · Start the journey